Visitors come to museums ready to learn, feel, and share. The visit often breaks down inside the building: unclear wayfinding, static interpretation, crowded galleries, and limited support for different access needs. This project asked how museums could use existing resources and thoughtful technology to make the visit more interactive, inclusive, and socially meaningful. 观众进美术馆时往往是有期待的:想学习,想被触动,也想把这次体验分享给别人。问题发生在馆内:动线不清、展签太静、人群太挤,不同语言和无障碍需求也没有被真正接住。这个项目研究的是,美术馆能不能用已有资源和合适的技术,把参观从单向接收变成更互动、更包容、也更有社交意义的体验。
Key Findings核心发现
Expectations Outrun the Experience 期待跑在体验前面
86.8% of respondents visit for art and culture, and 77.4% visit to learn. Interest is not the problem. The breakdown happens when the in-gallery experience cannot support that intent. 86.8% 的人为艺术和文化而来,77.4% 是来学习的。问题不是观众没有兴趣,而是馆内体验没有接住这份兴趣。
Sharing Is Part of Visiting 分享本身就是参观的一部分
69.8% share museum visits on social media, and 43.4% expect some form of personalization. For visitors, the experience continues after they leave the gallery. 69.8% 会把参观发上社交媒体,43.4% 期待某种个性化。对观众来说,体验并不会在出馆那一刻结束。
Wayfinding Breaks Immersion 找路本身就在破坏沉浸
Across interviews, the most common pain point wasn't the art. It was not knowing what to see, in what order, or what any of it meant without a placard. Navigation anxiety eats the attention that exhibits are competing for. 访谈里最常见的痛点不是作品,是不知道该看什么、按什么顺序看、没有展签就看不懂。找路的焦虑在吃掉展陈争夺的那部分注意力。
Inclusion Is Unfinished Work 无障碍还是半成品
Sensory-sensitive visitors, non-native speakers, and visitors with mobility or vision needs described the same museums very differently. Accessibility features exist, but they're bolted on, not designed in. 感官敏感的观众、非母语者、行动或视觉有需求的观众,描述的是完全不同的美术馆。无障碍功能是有的,但是外挂上去的,不是设计进去的。
The gap we kept hearing about
Museums aren’t losing visitors because people stopped caring about art. Our survey confirmed the opposite: 86.8% of respondents said they visit for art and culture, 77.4% to learn something new, 69.8% to share it on social media afterward. The motivation is intact.
What breaks is the middle: the visit itself. People described arriving excited and leaving drained. Crowds at the famous works. Nothing at the quiet ones. Wall labels that explain neither the piece nor the room. A map that helps if you already know what you’re looking for.
The question wasn’t how do we get people to museums. It was why do the people who come leave wishing they hadn’t.
Sarah, on a Tuesday
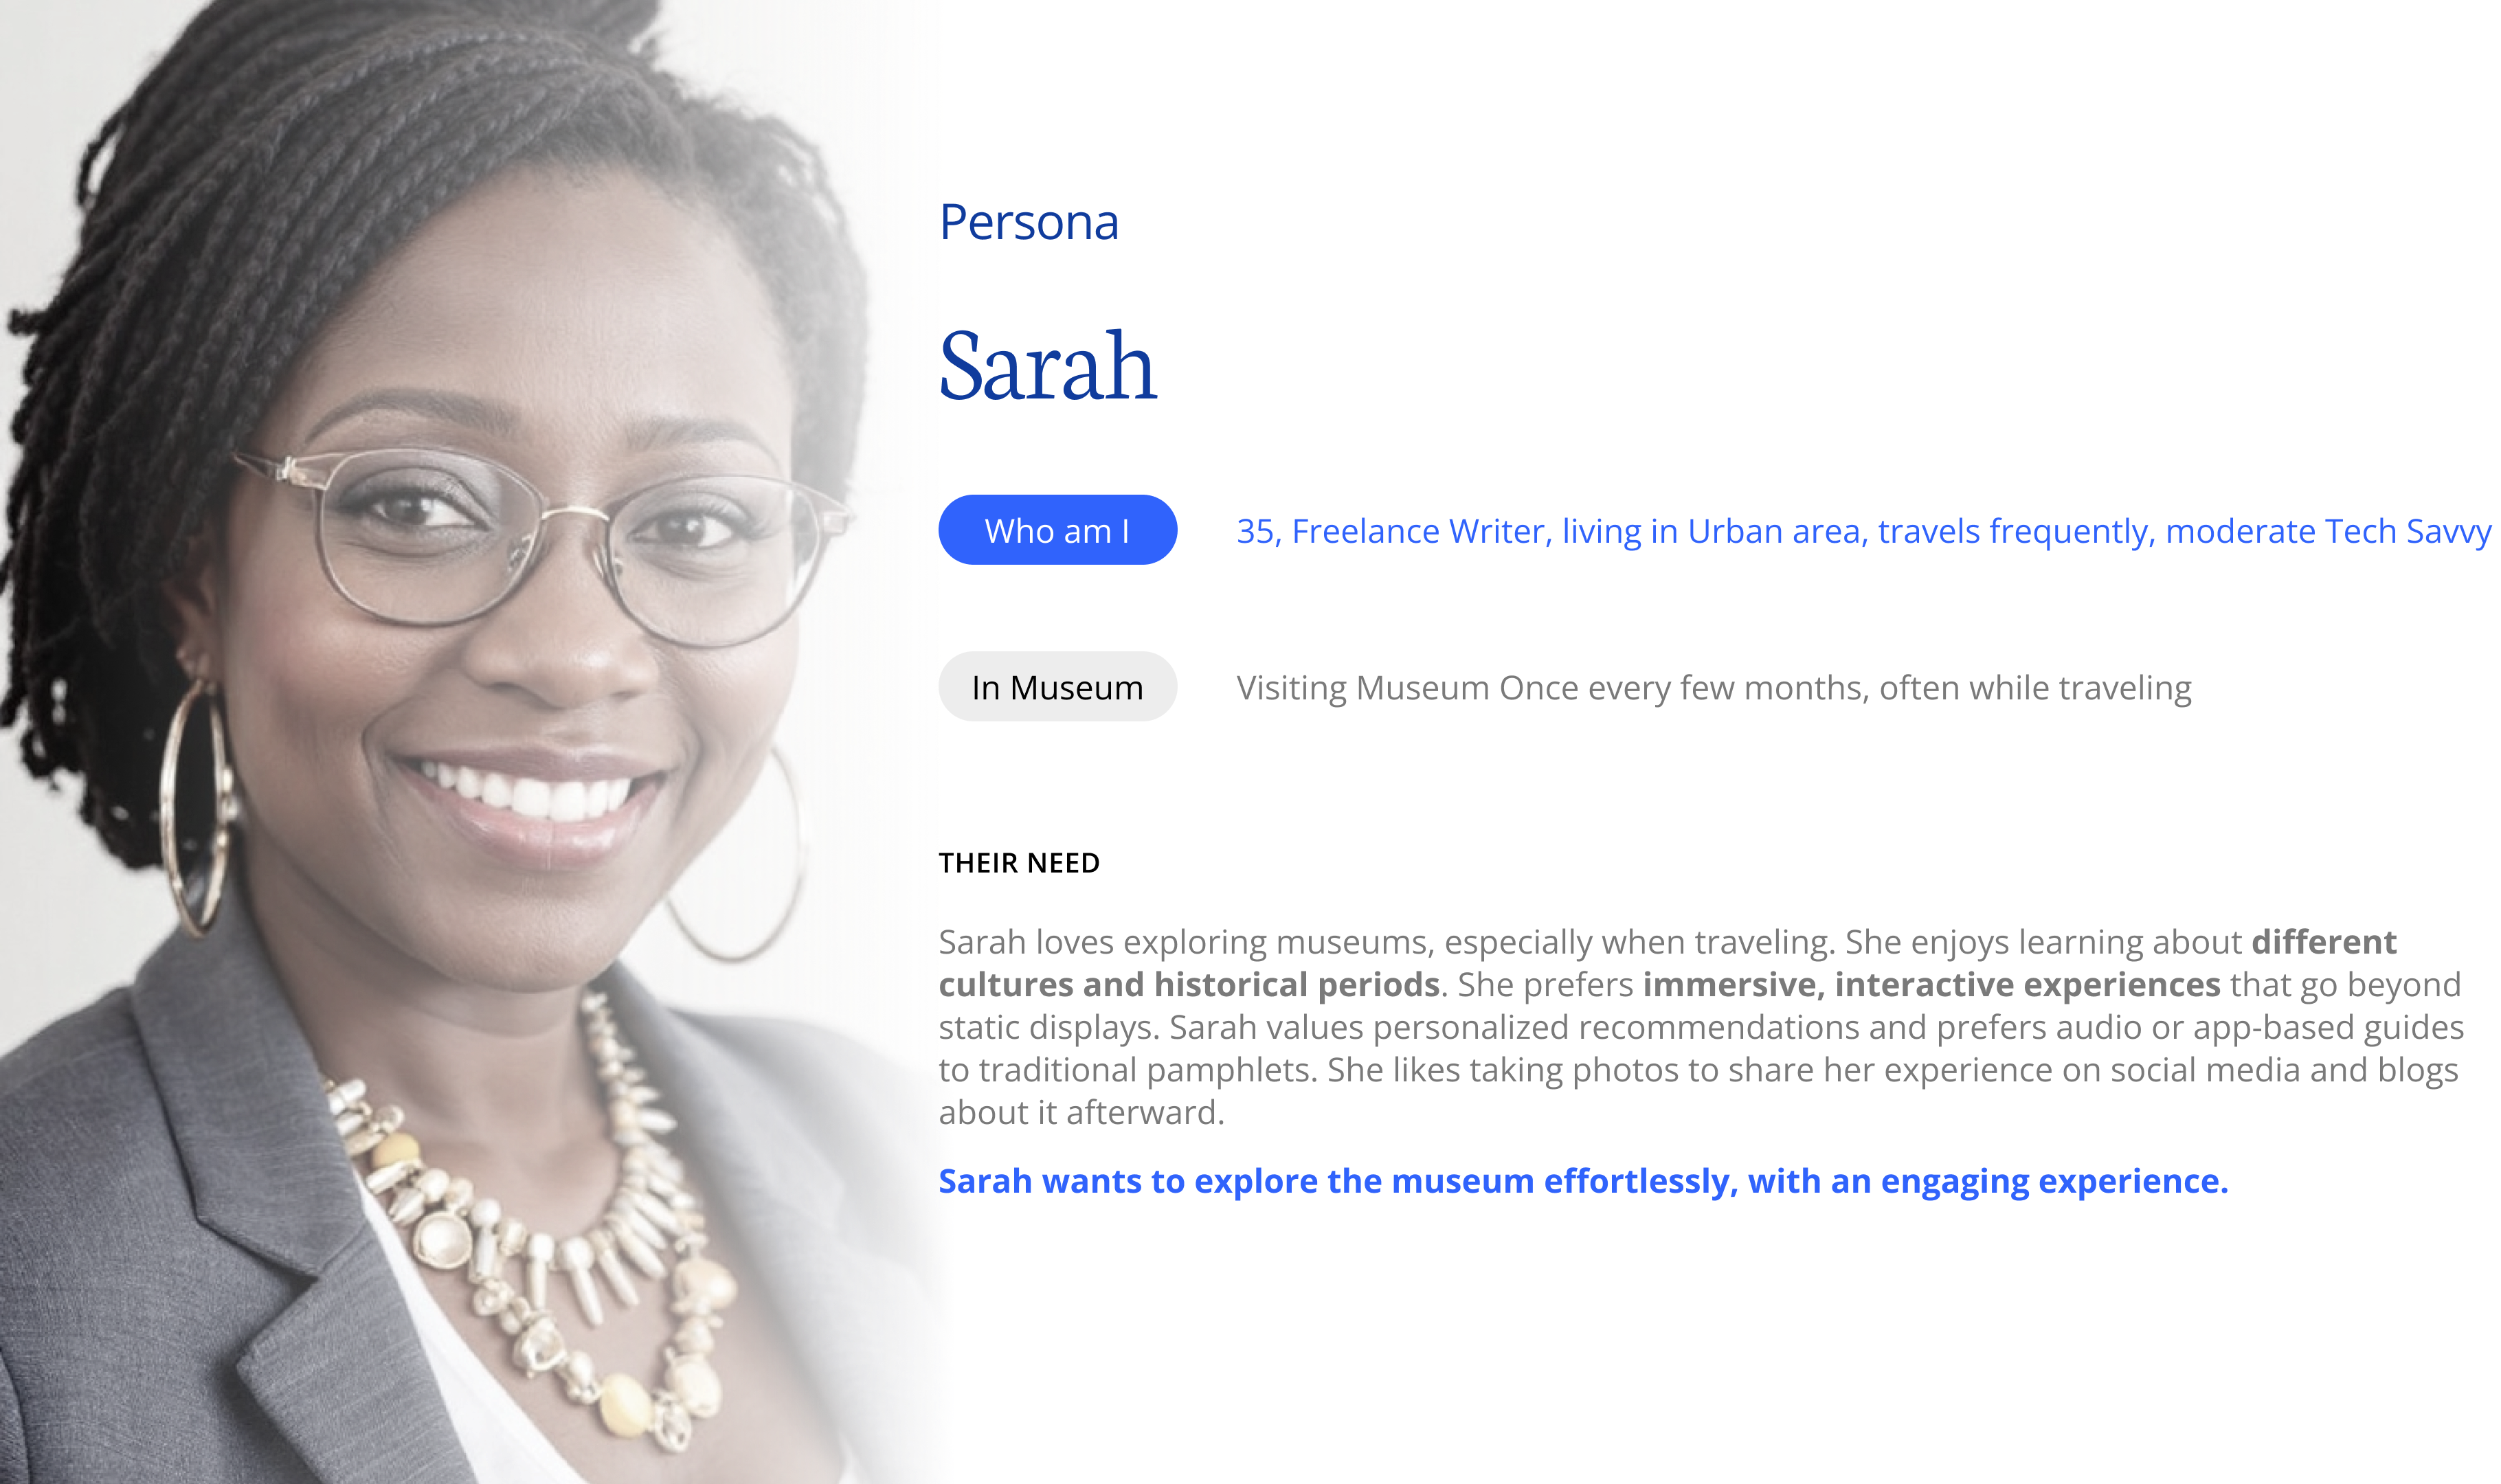
Sarah isn’t a museum professional and she isn’t a tourist with a checklist. She’s informed enough to want depth, independent enough to reject a group tour, social enough that the visit only feels complete once she’s told someone about it.
The visitor journey, and where it breaks
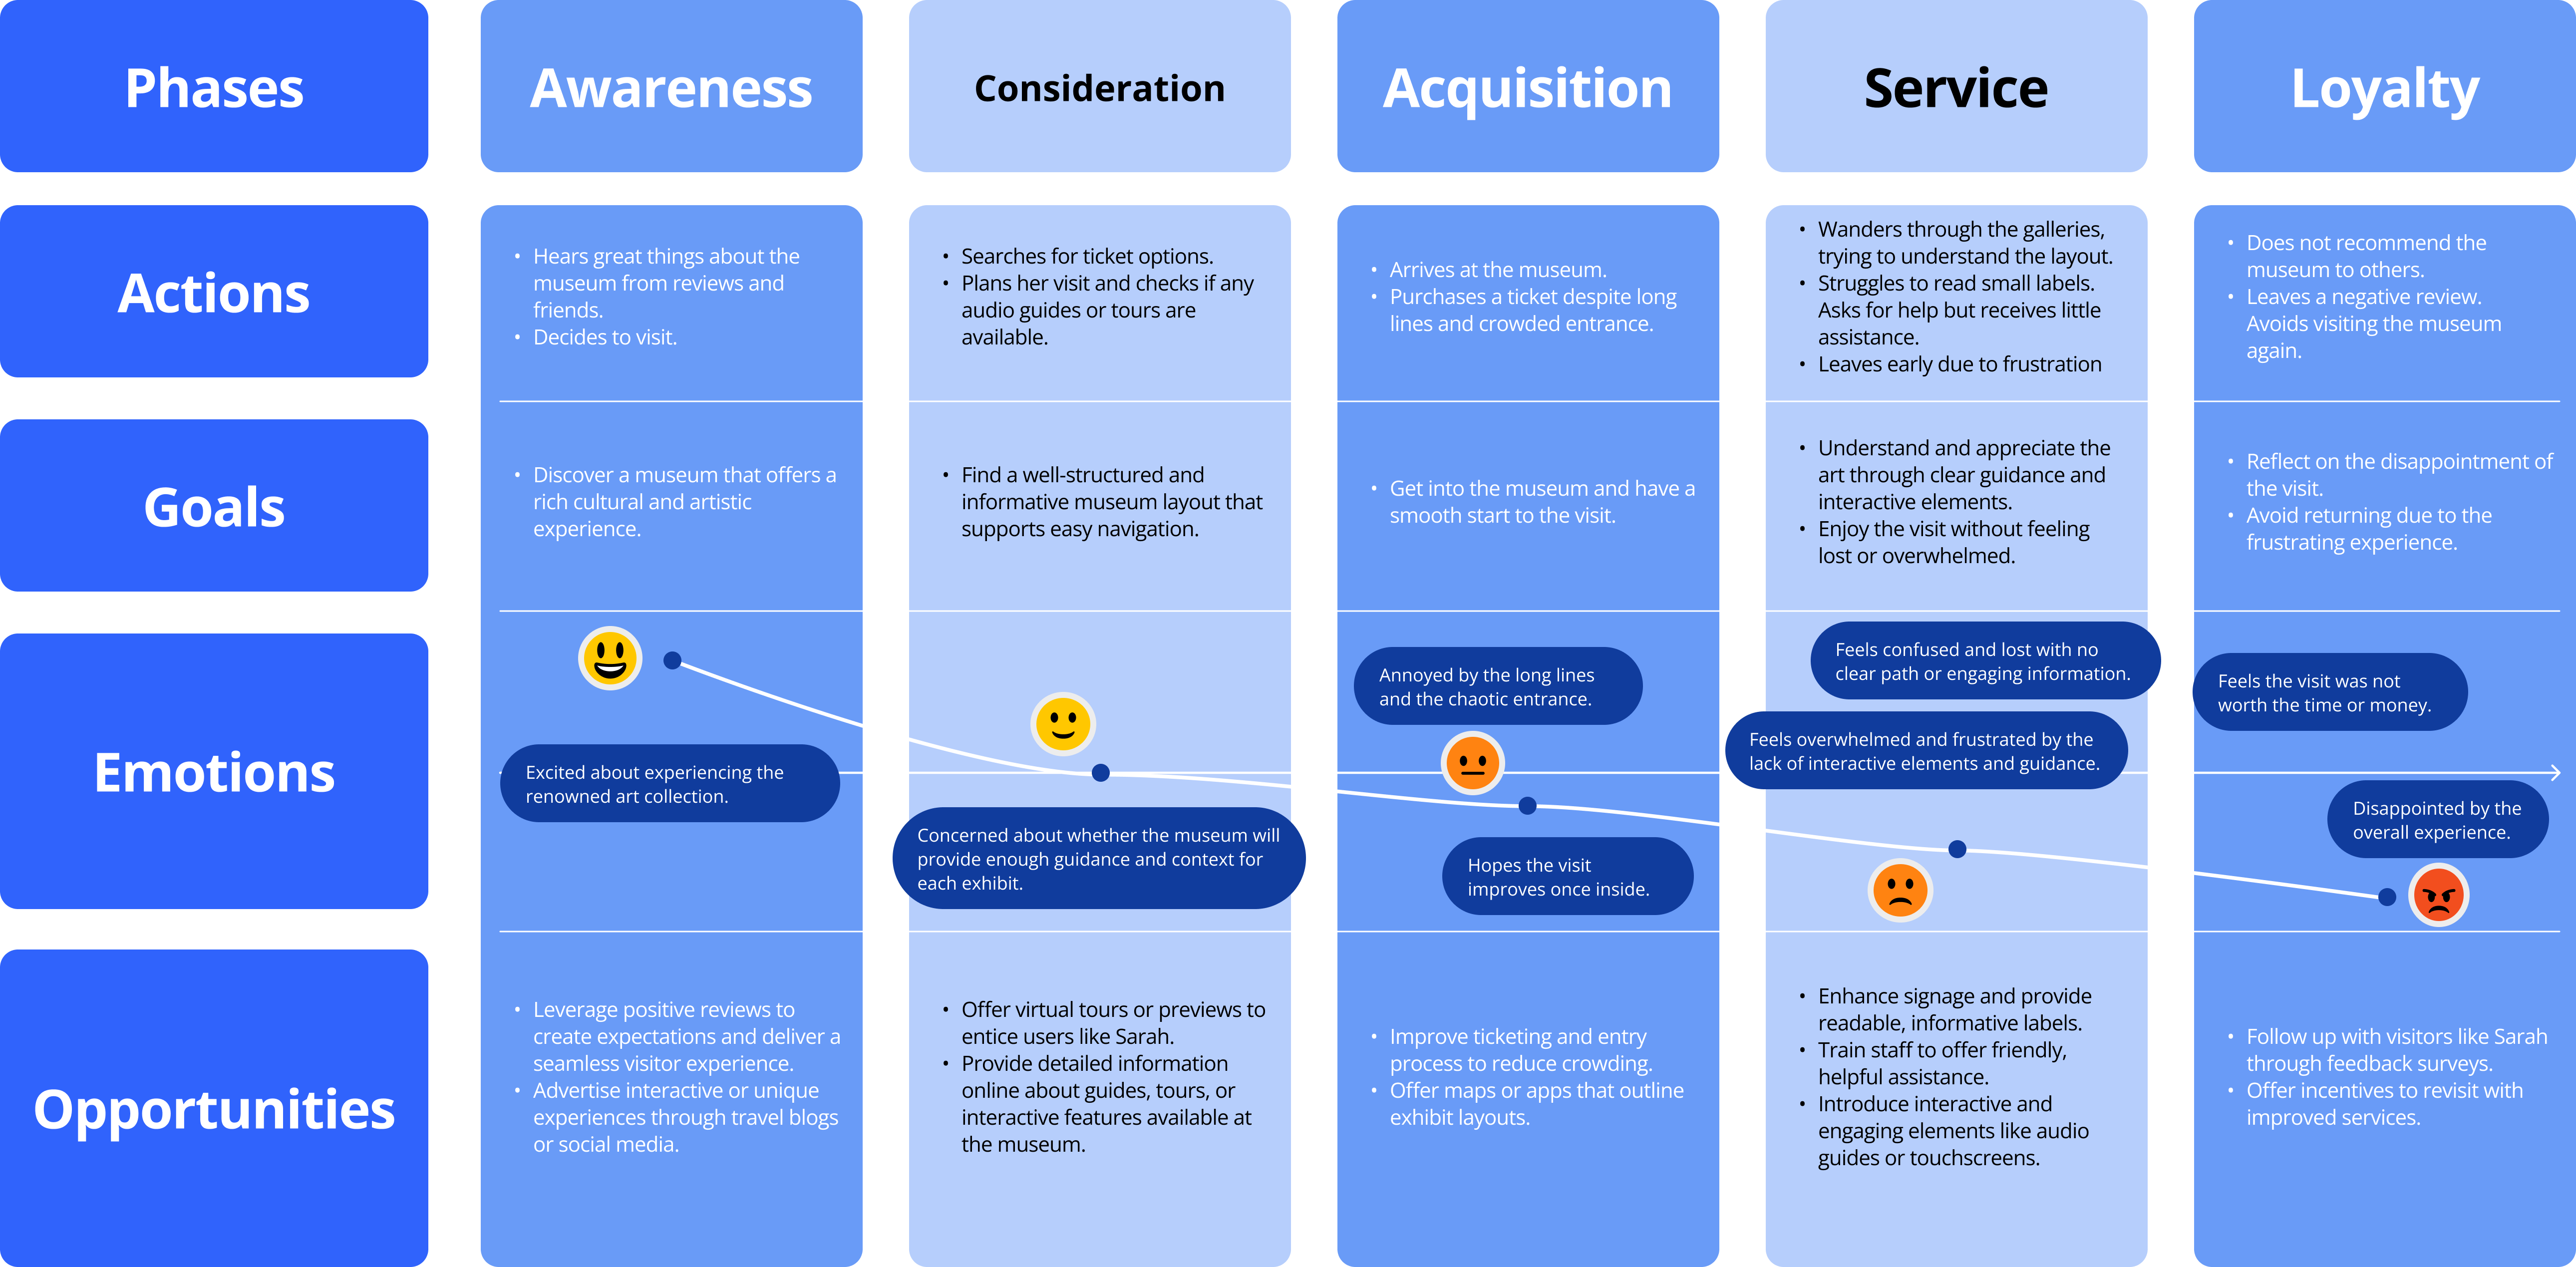
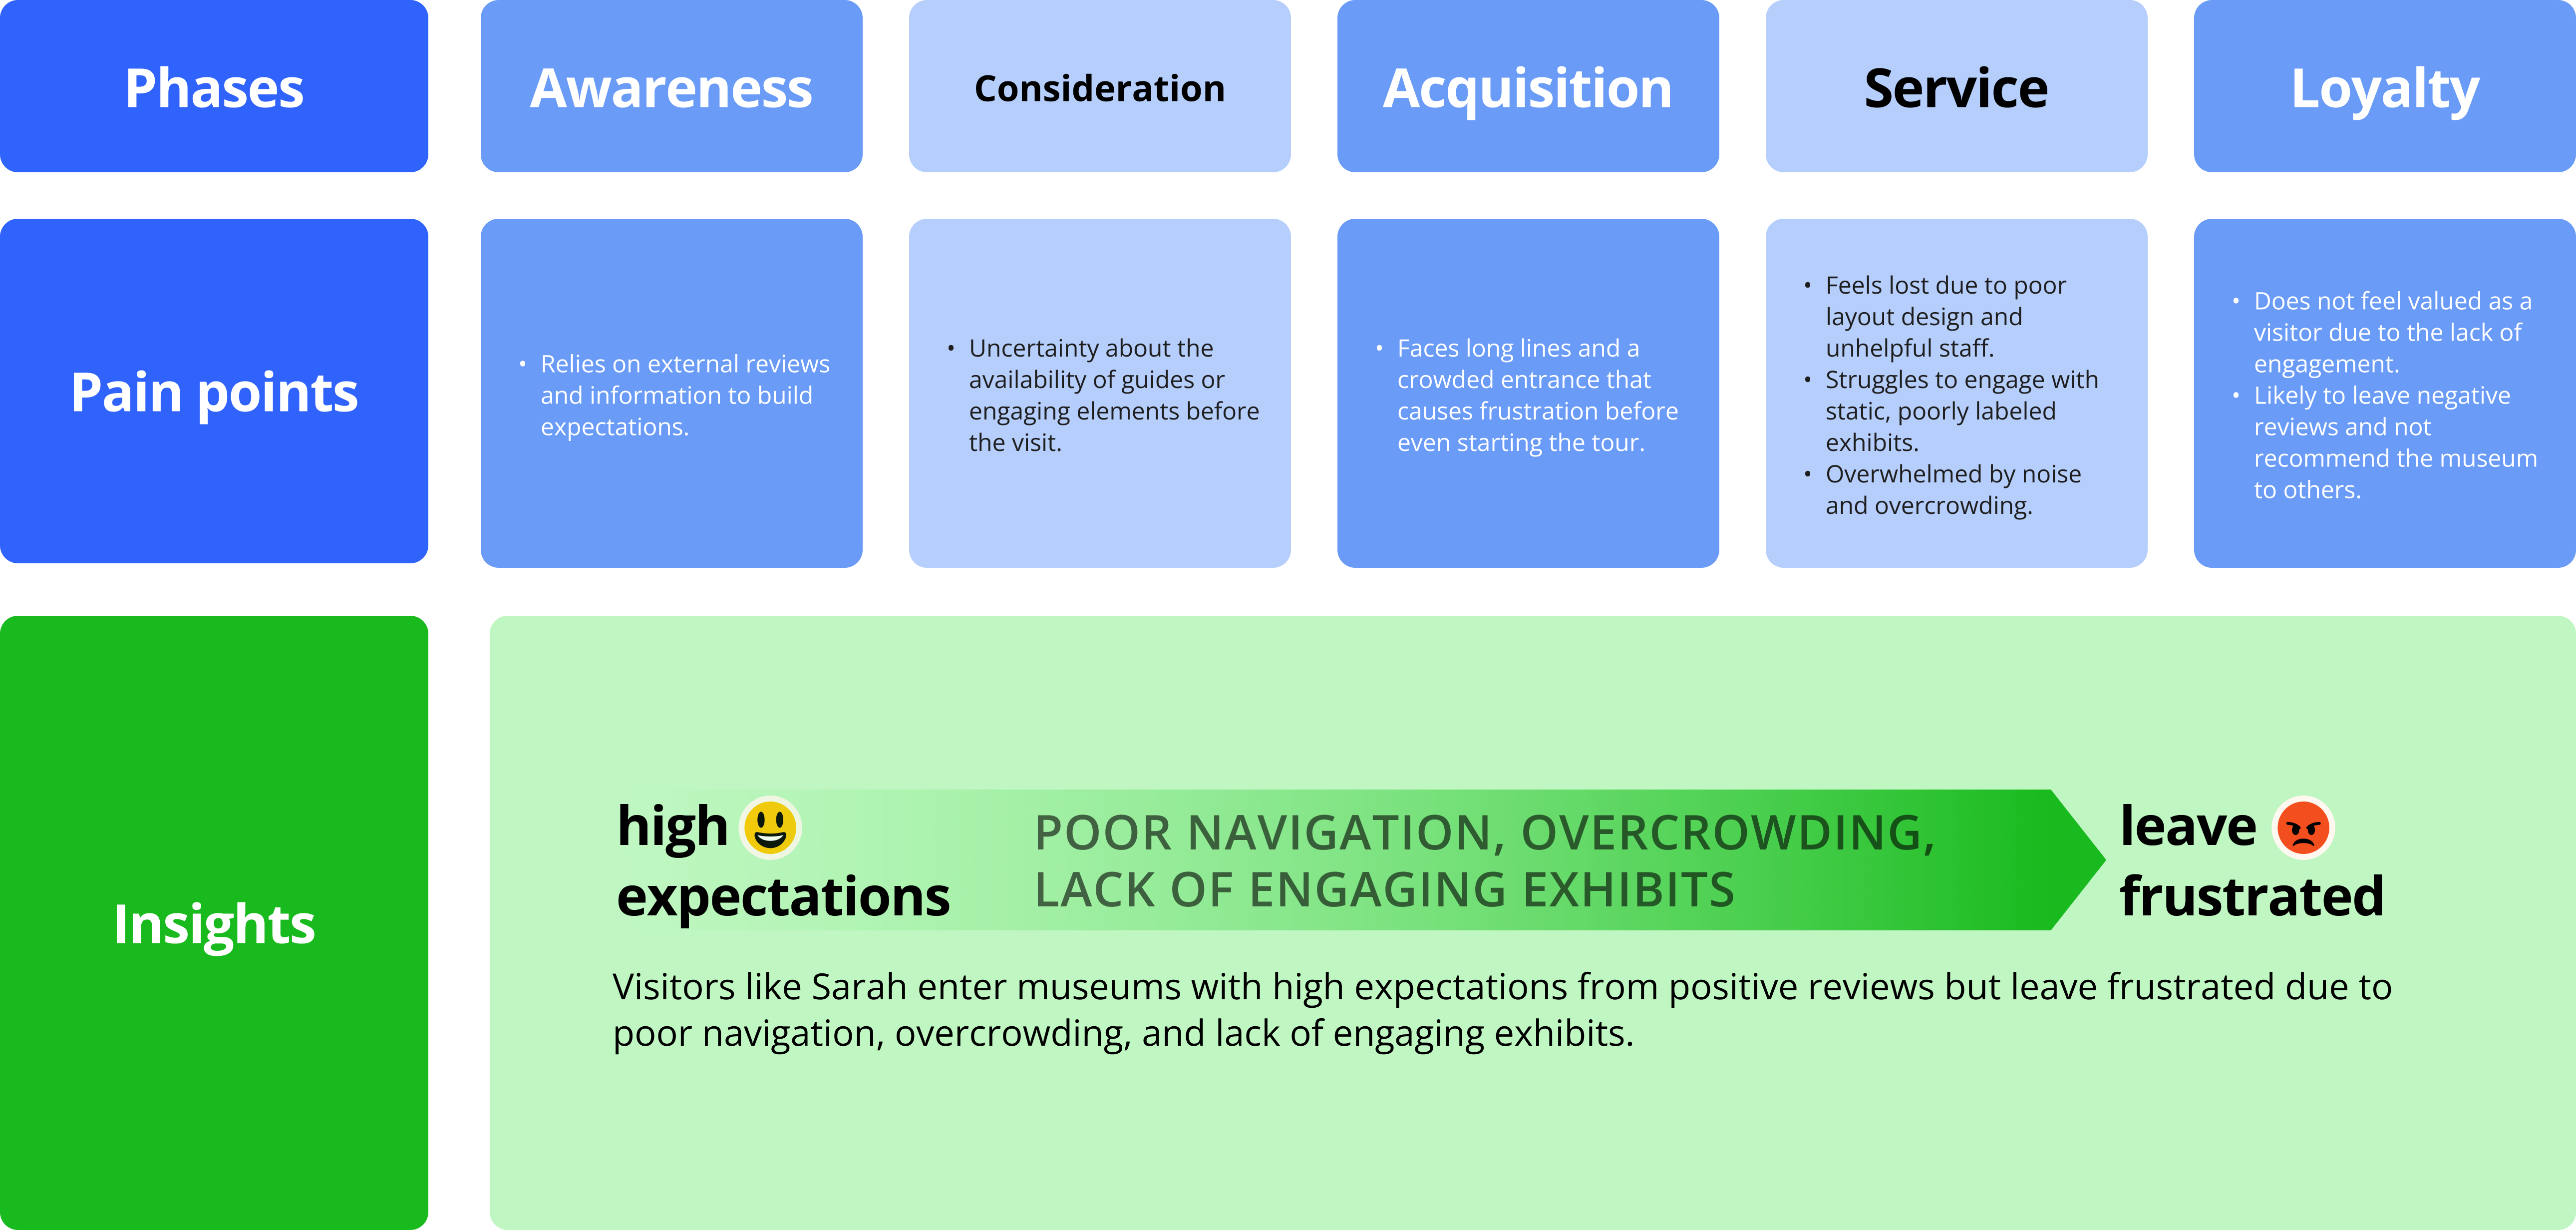
The core failure pattern: high expectations → poor navigation, overcrowding, lack of engaging exhibits → visitors leave frustrated. Every downstream research activity targeted one of those three middle links.
What the survey said
Four data points that framed the whole study
n = 53. Visitors arrive motivated to learn, ready to share what they saw, and already expecting the museum to meet them halfway. What happens between arrival and departure is where the design problem lives.
"86.8% visit for art and culture. 77.4% to learn."
Reading: visitors show up wanting depth. A design that defaults to spectacle leaves that intent on the table.
"69.8% share their visit on social media."
Reading: the visit doesn't end at the door. The artifact people take home is a photo and a caption, and museums can shape what that looks like.
"43.4% expect some form of personalization."
Reading: almost half of visitors already assume the museum will meet them where they are. Generic audioguides don't clear that bar.
"60.4% aged 18–30. 50.9% hold a master's degree. 69.8% female."
Reading: the sample skews young, educated, and majority-female. The framework must work for them first, and the inclusion pillar picks up everyone they don't represent.
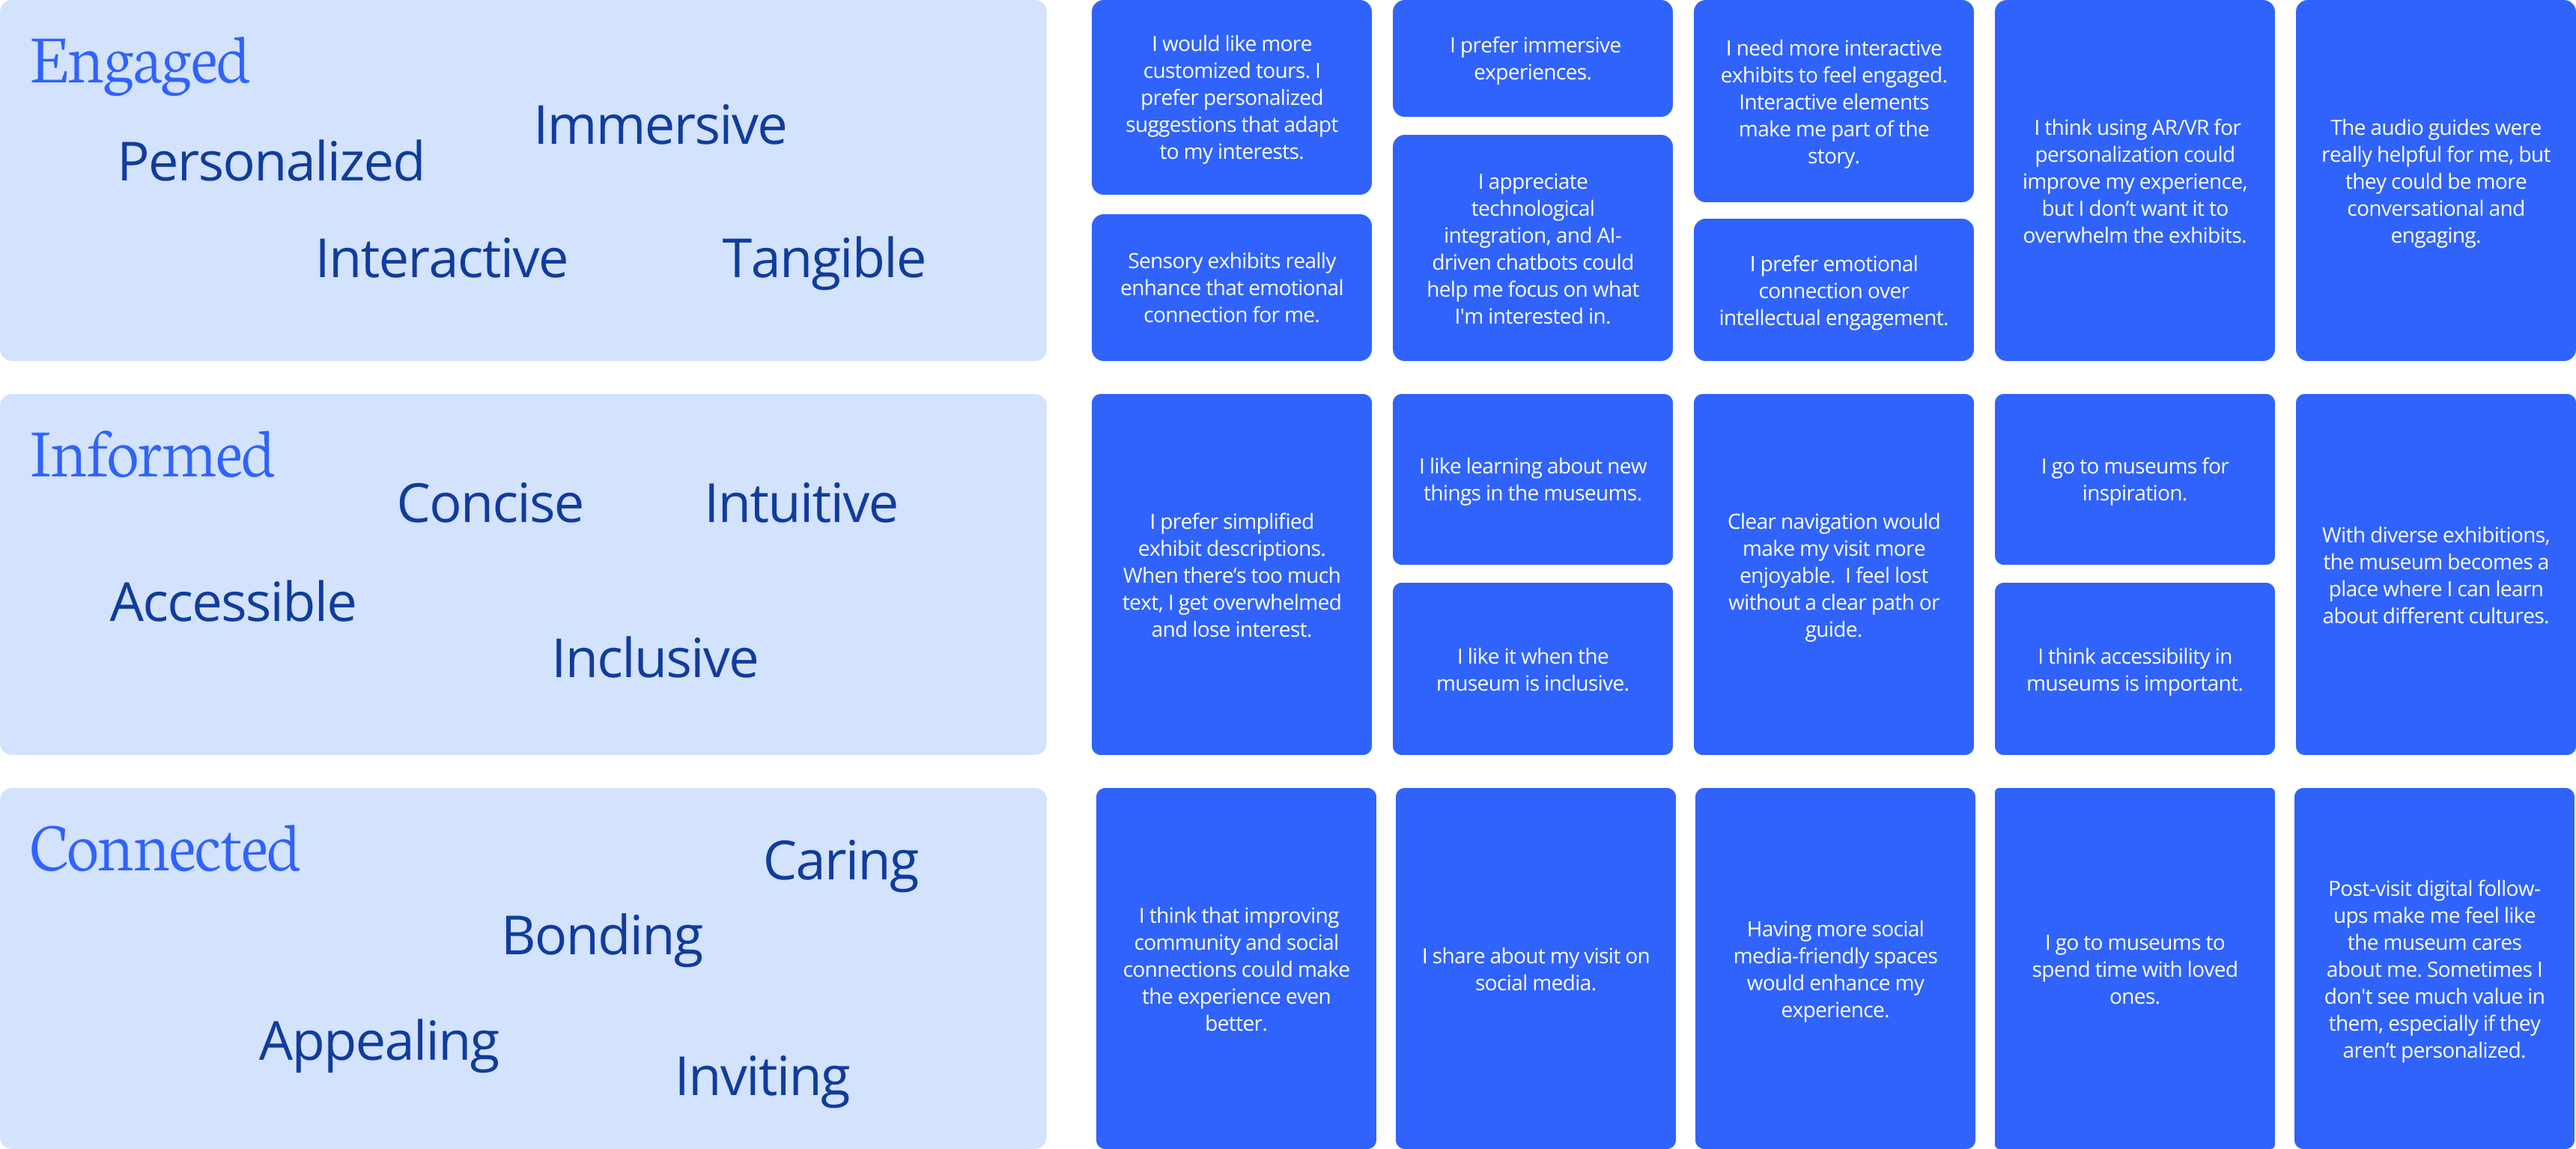
Twelve clusters on a wall
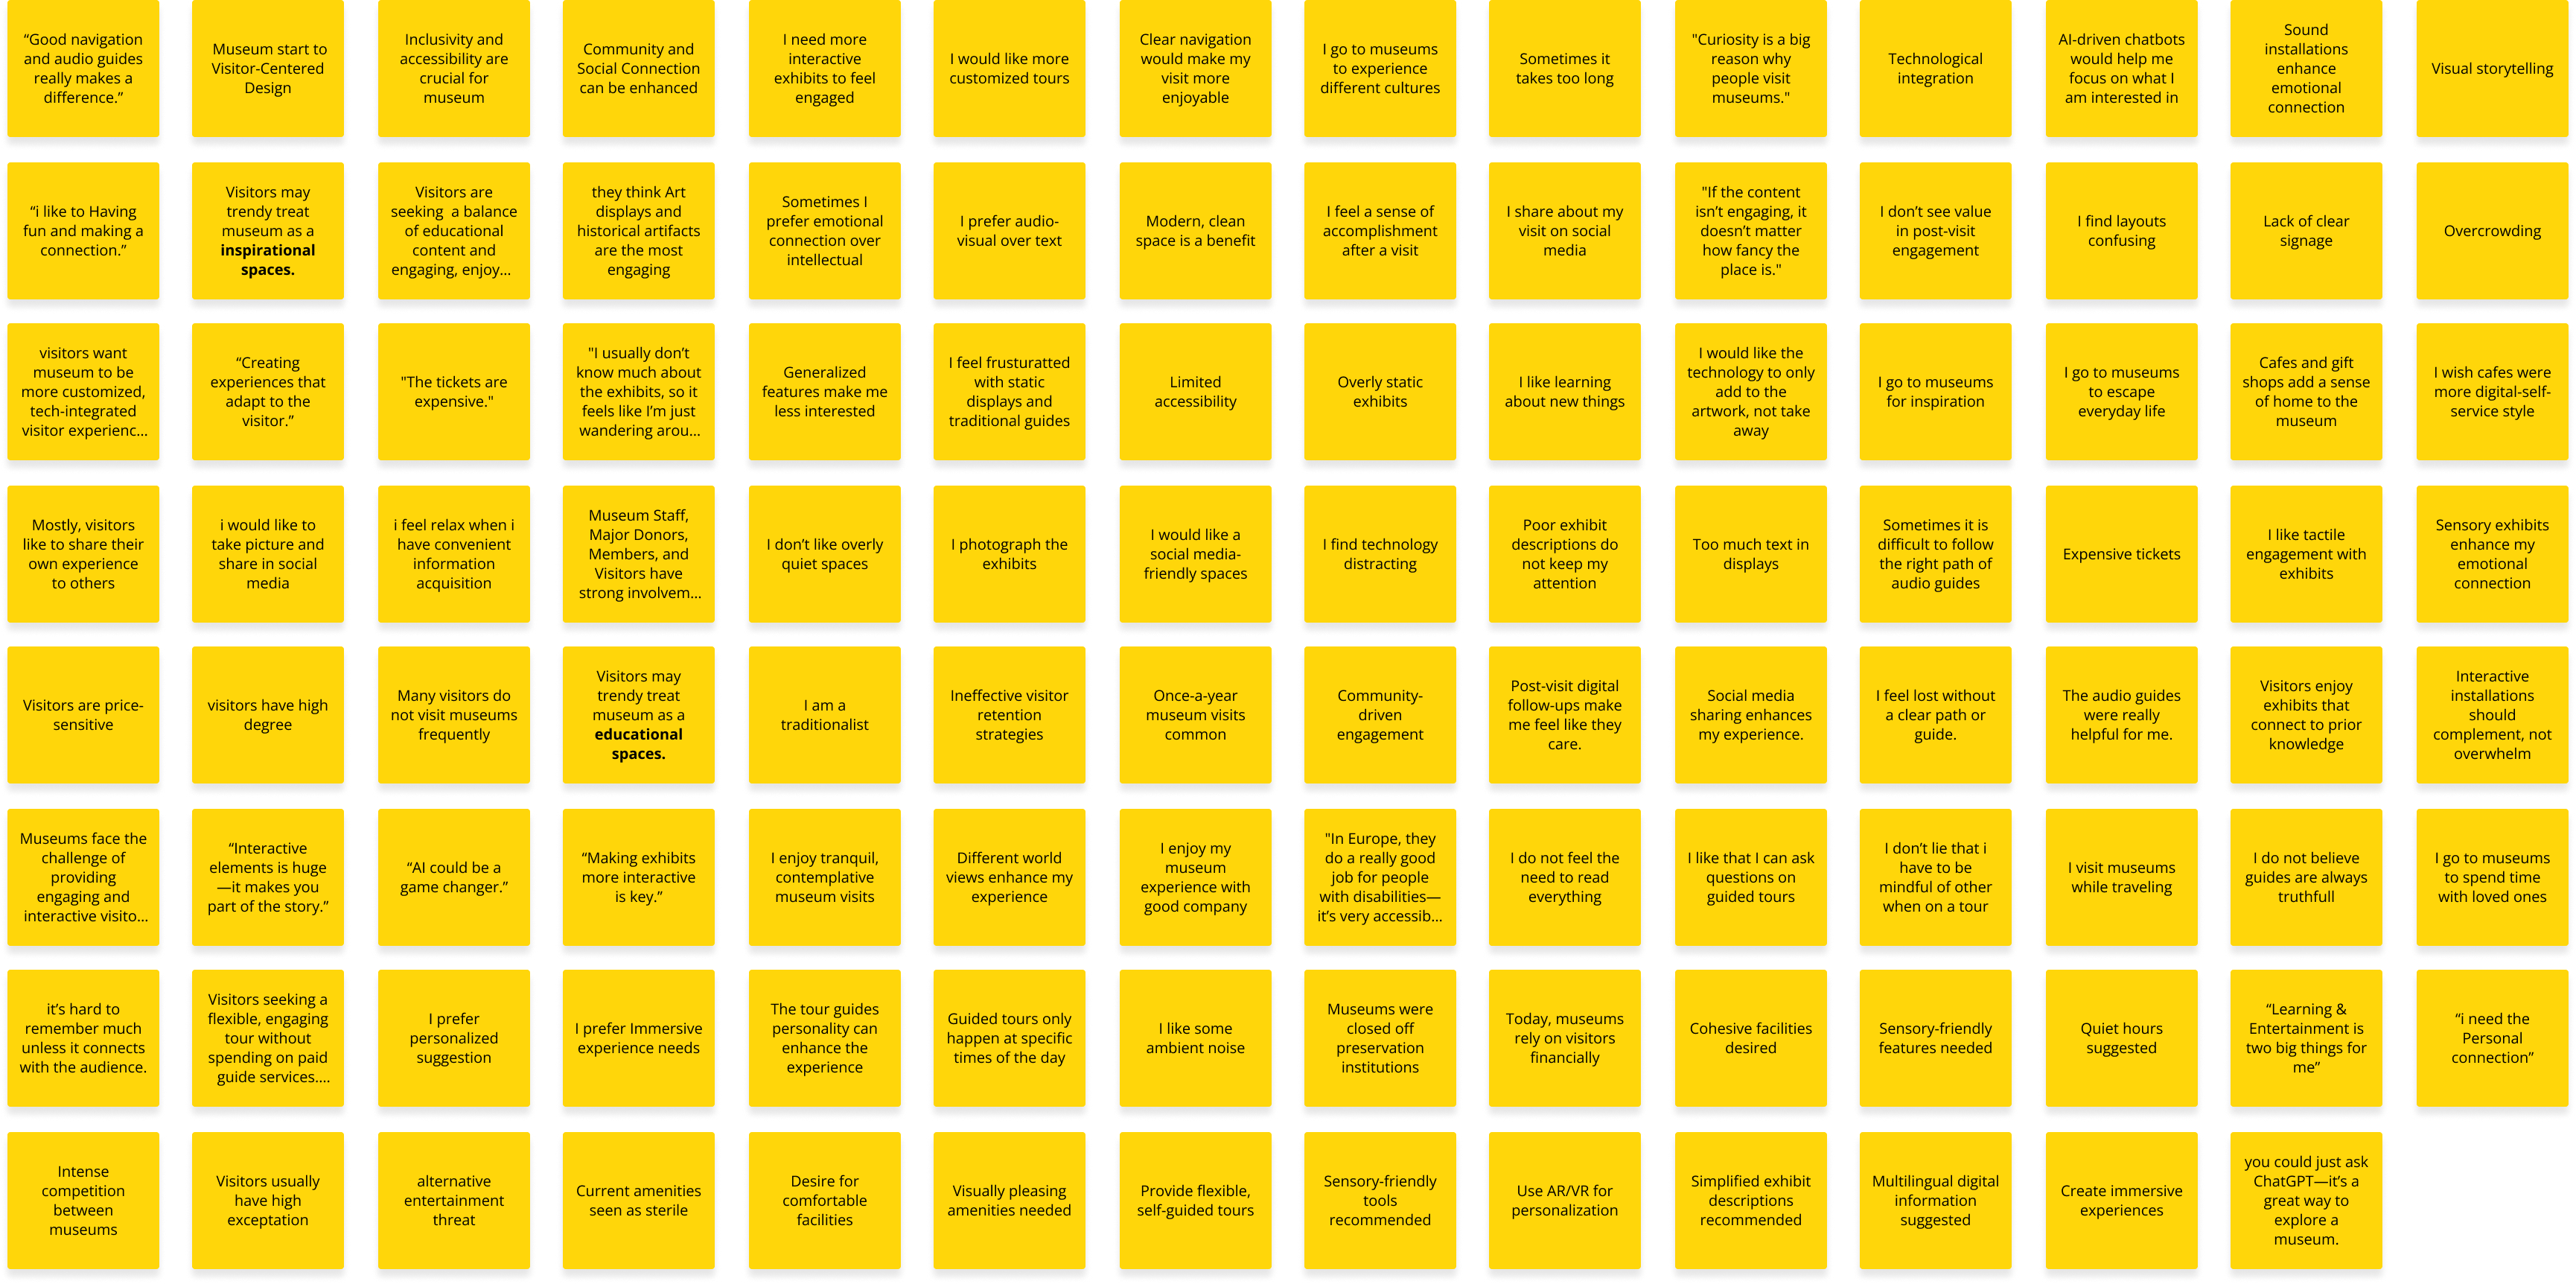
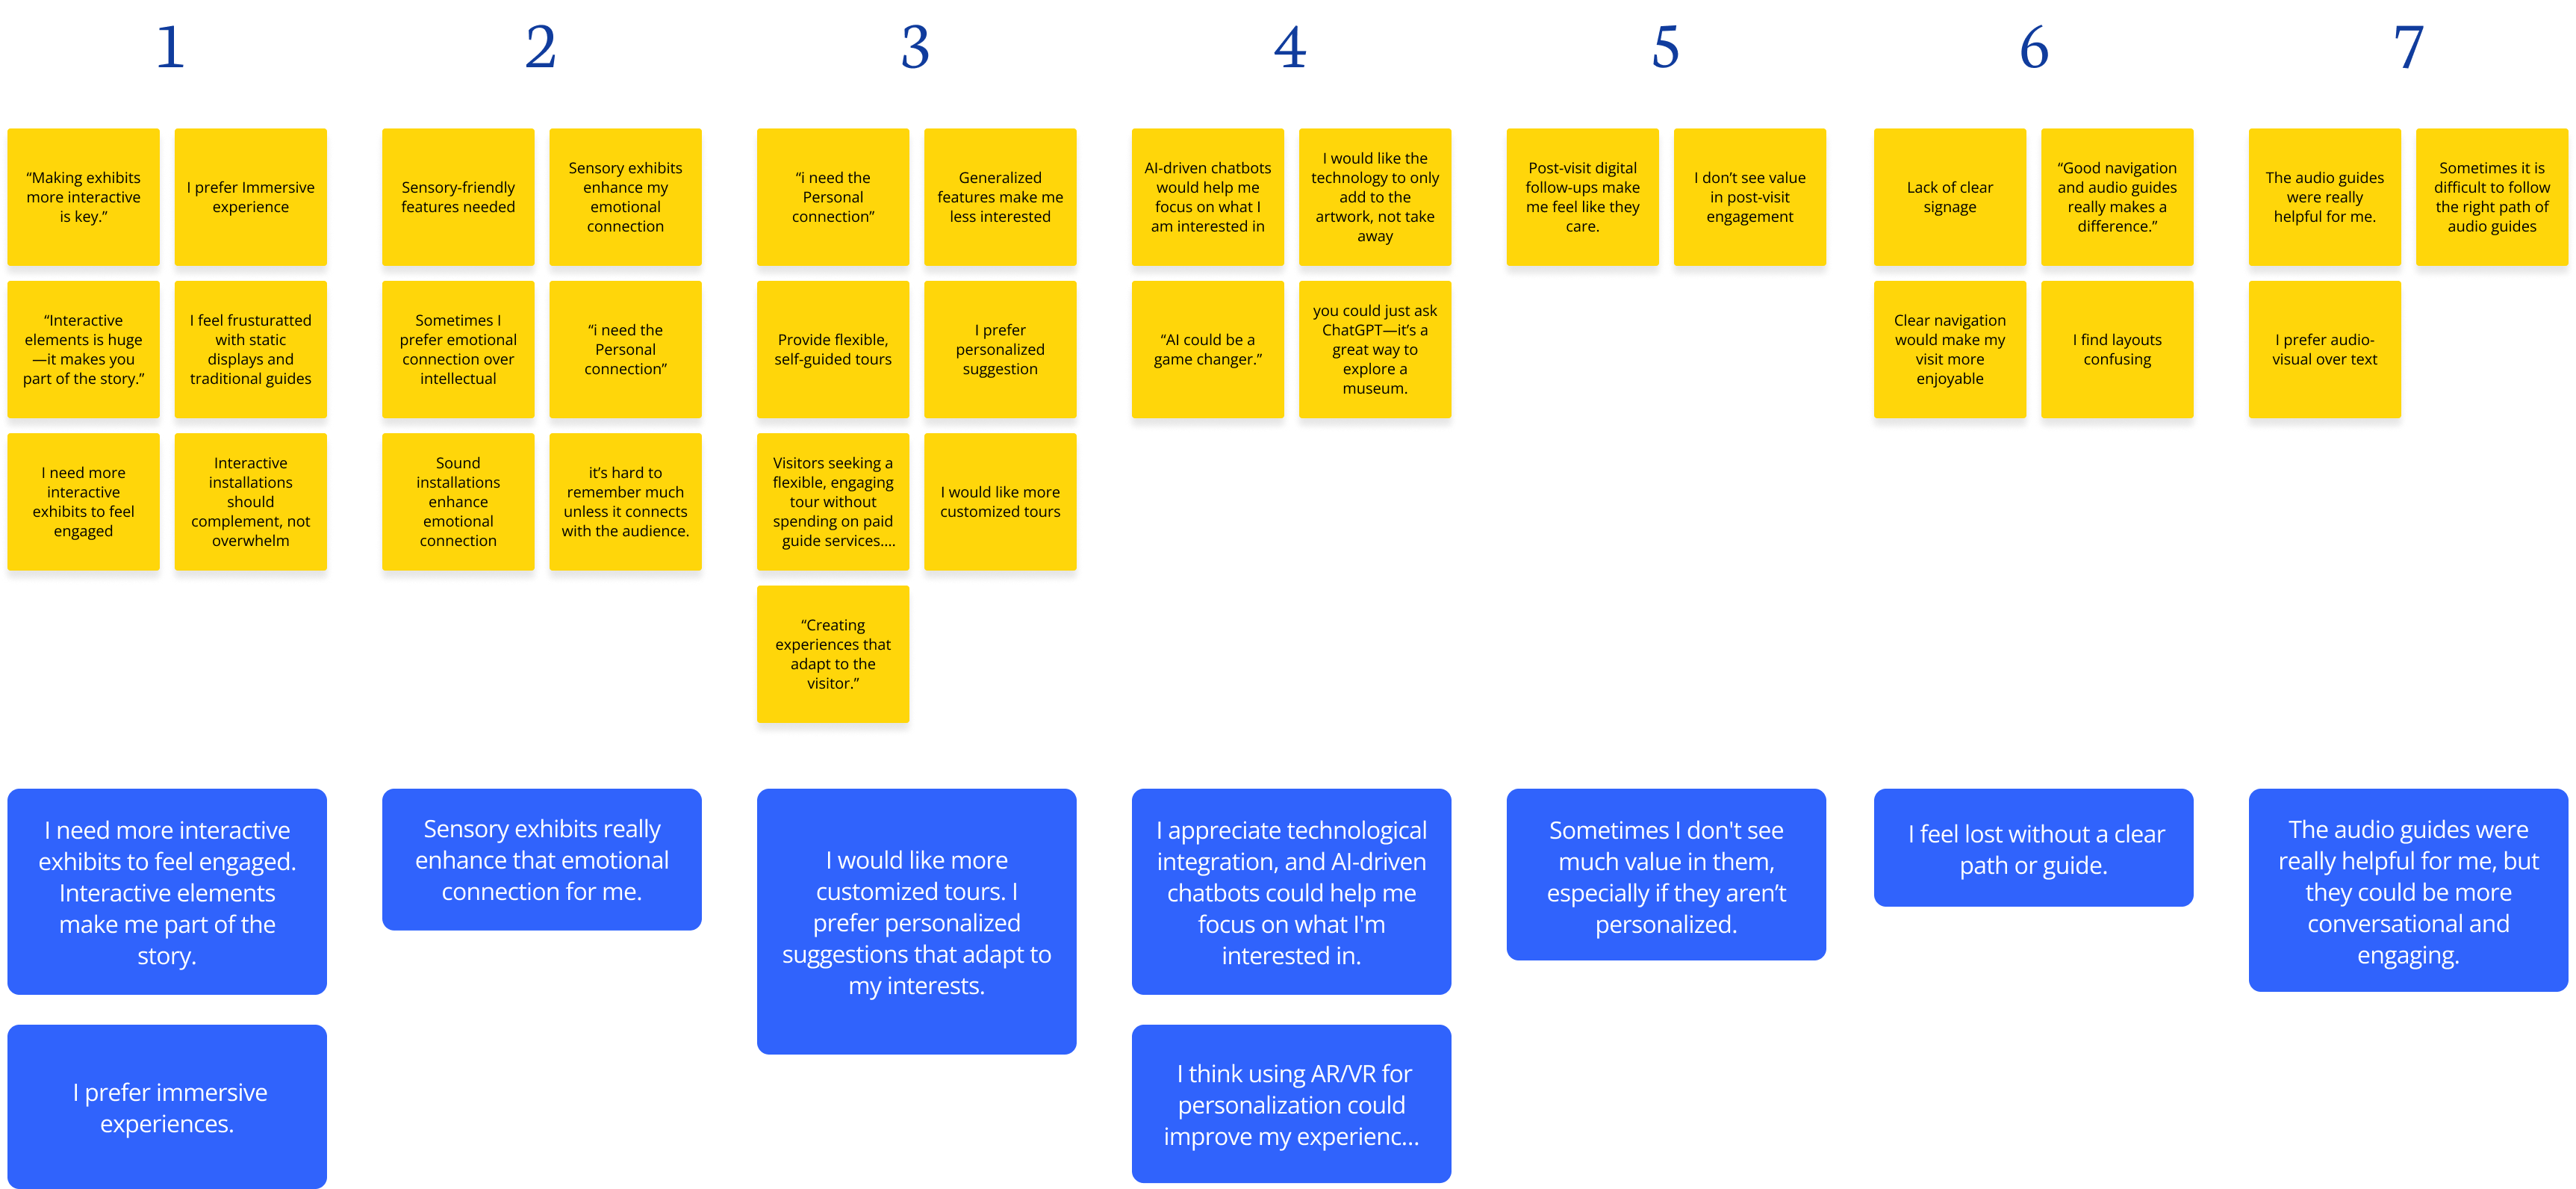
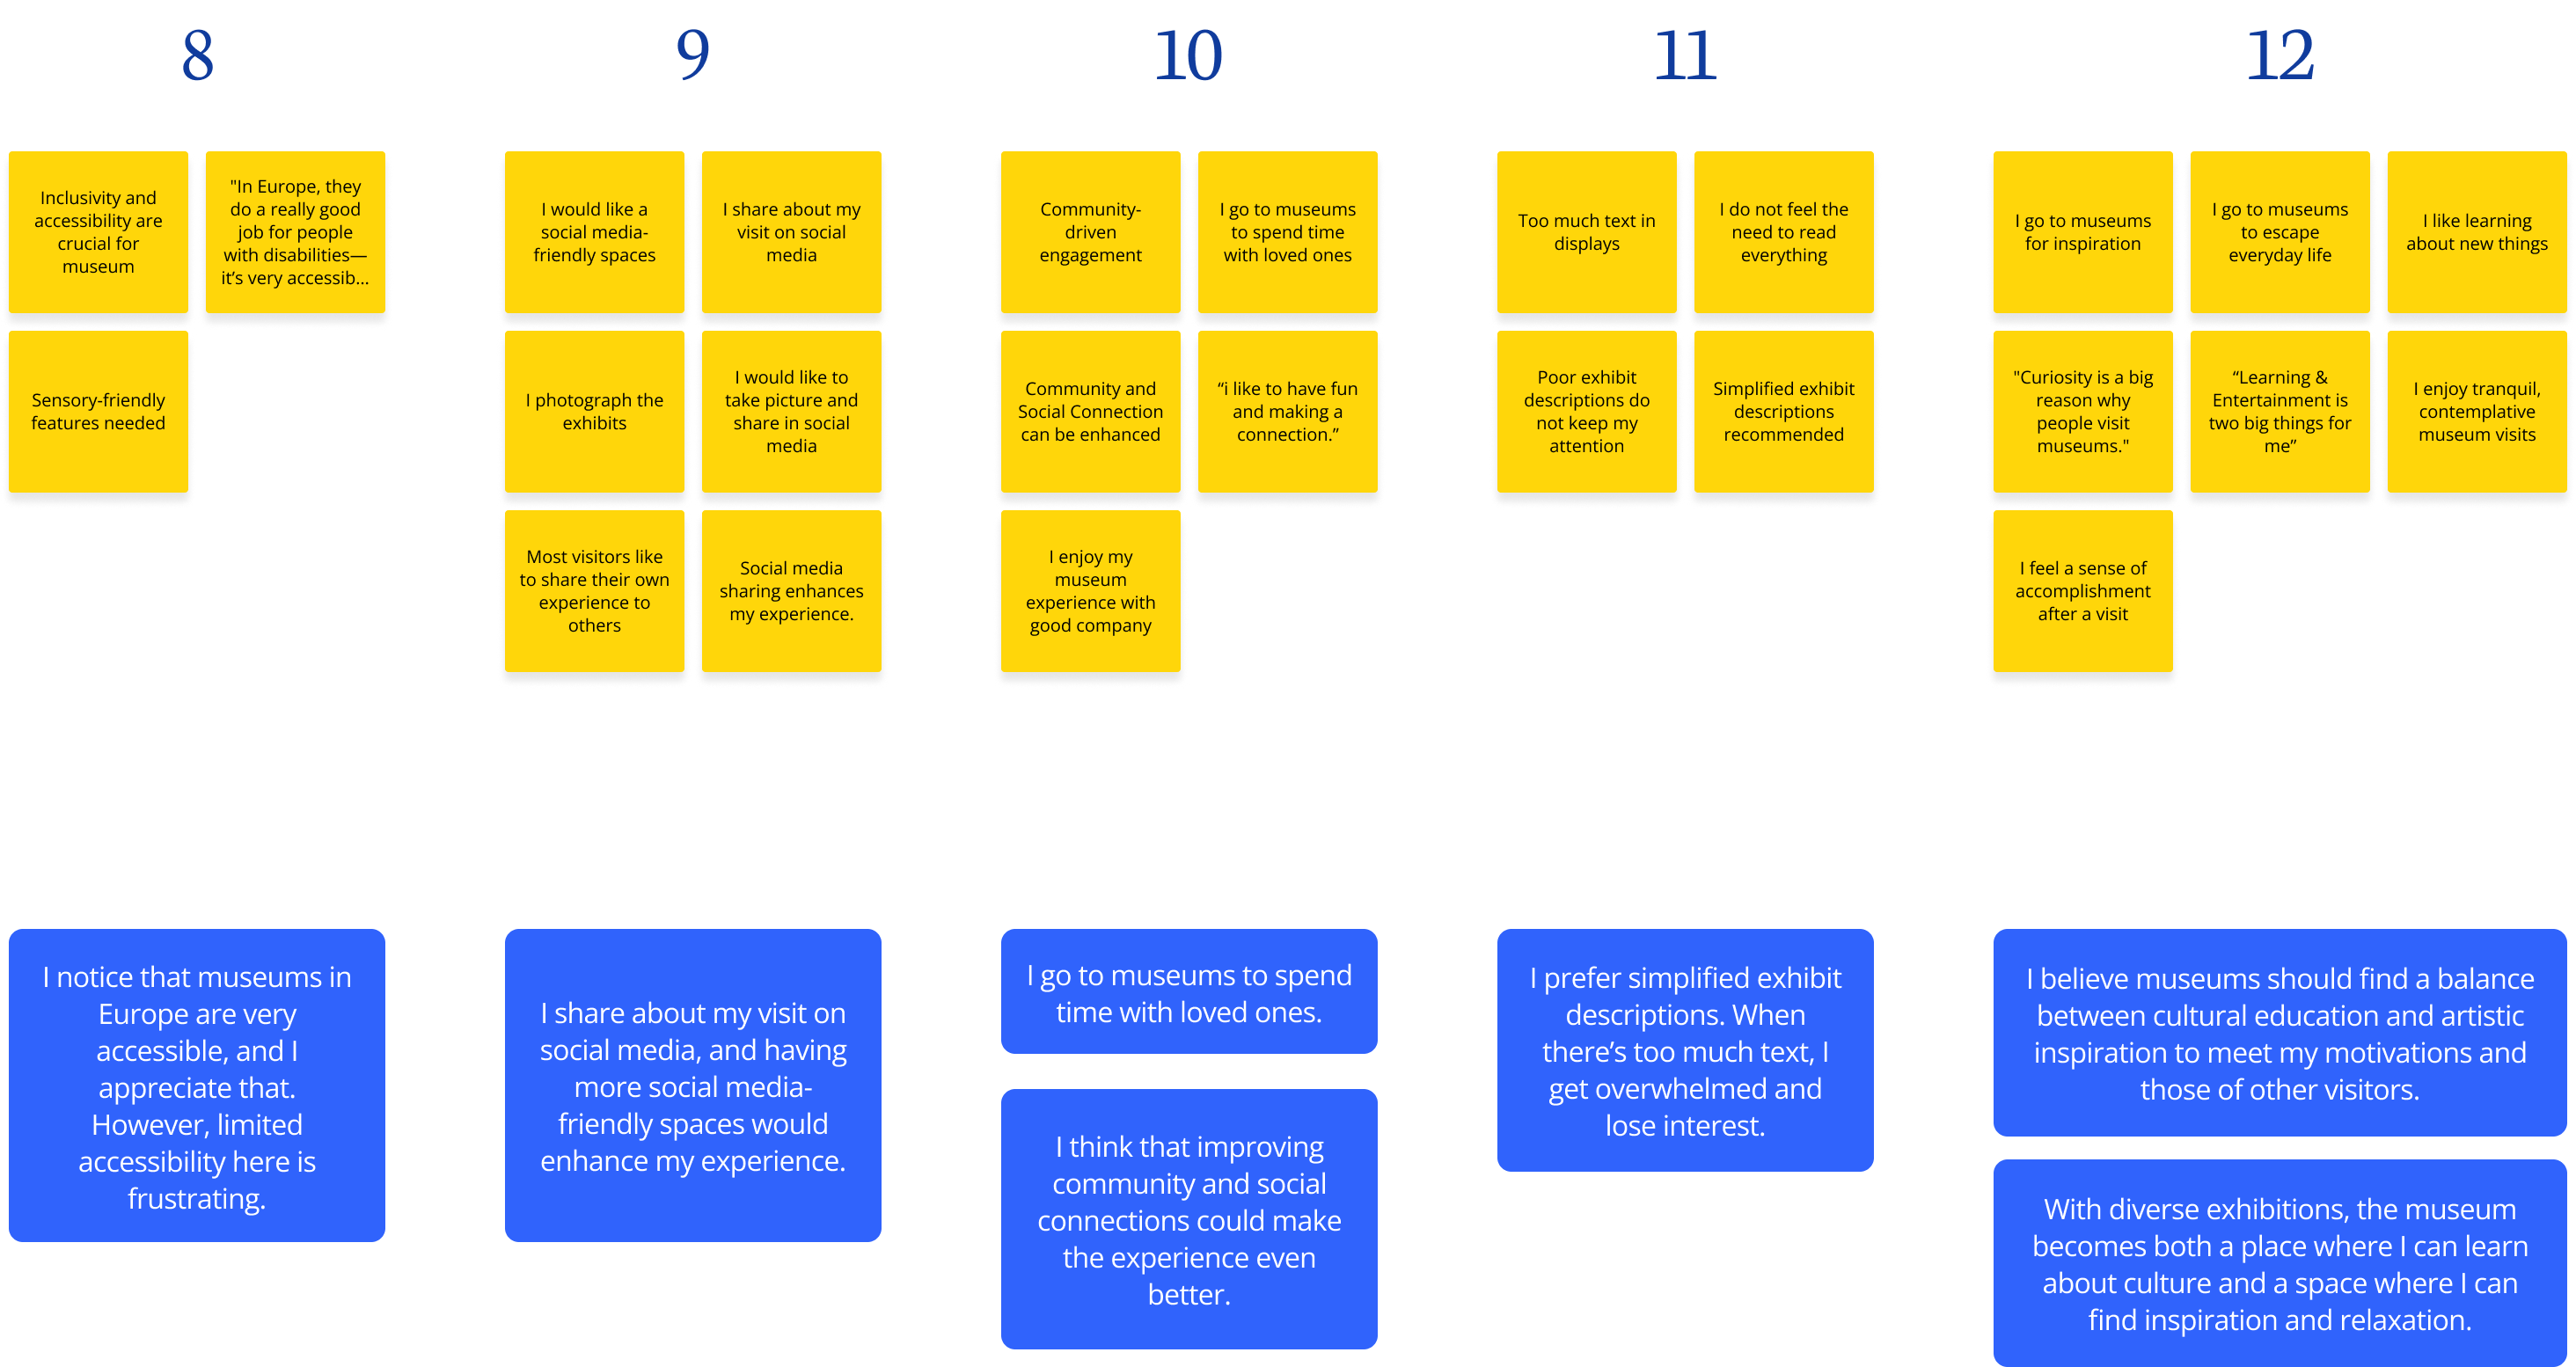
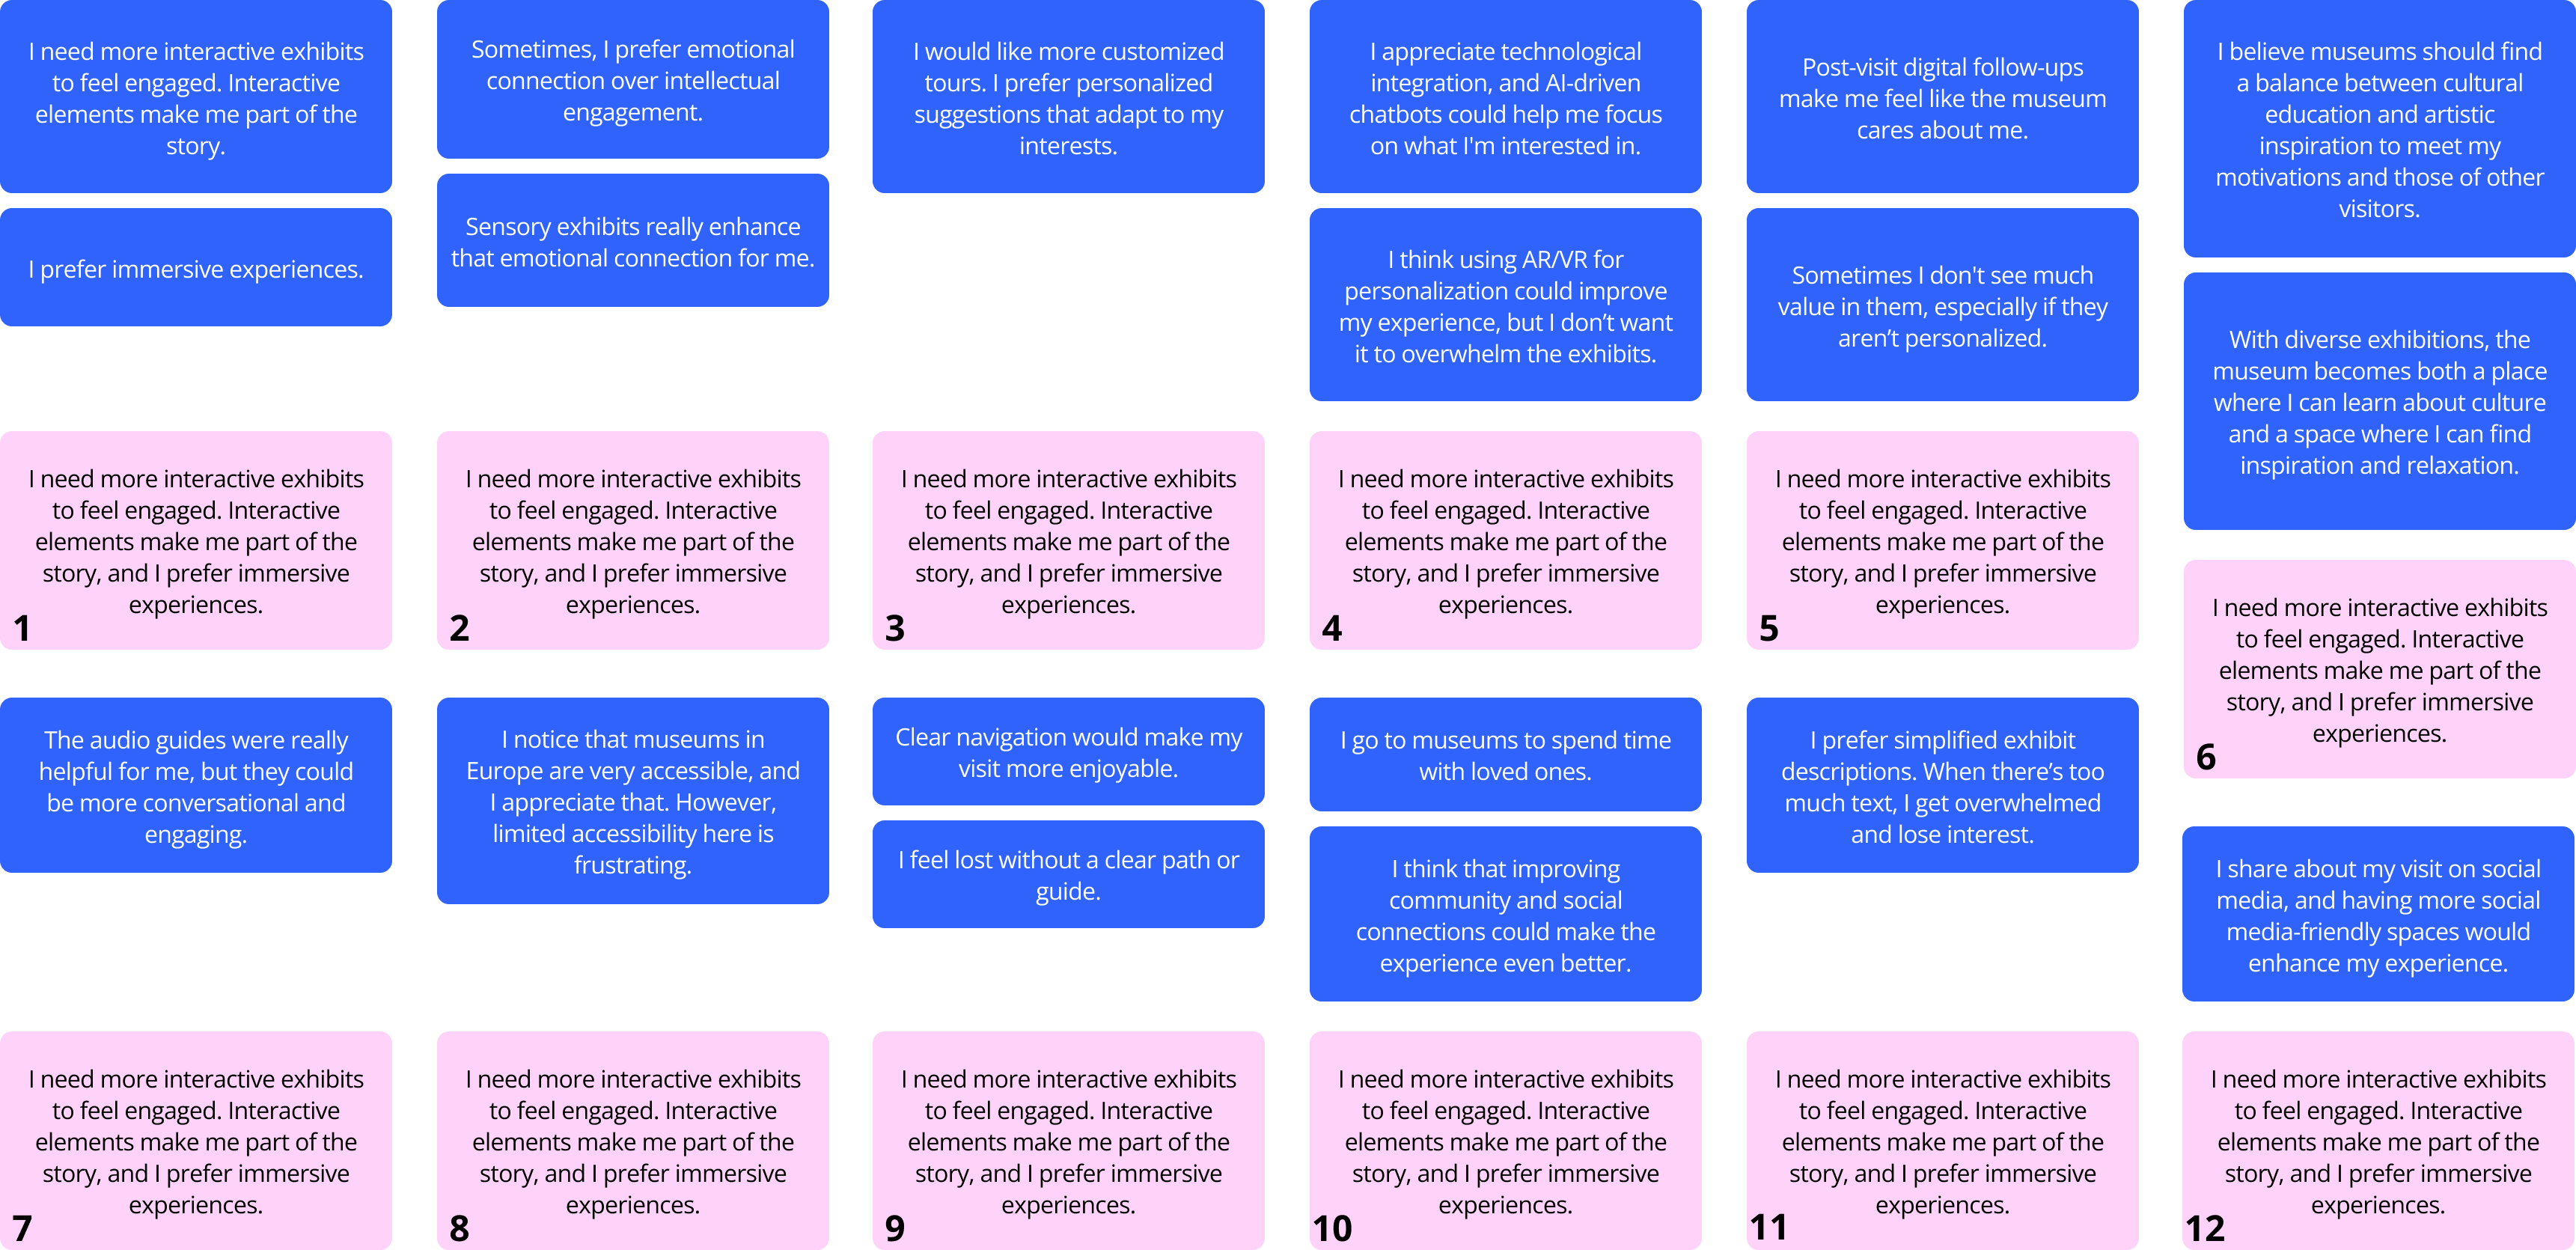
Interviews and open-response survey data produced hundreds of raw observations. Over two weeks of affinitization we pulled them into twelve clusters: the grammar of what visitors actually say when they talk about museums.
I feel ENGAGED
The twelve clusters collapsed into three feature families (Engaged, Informed, Connected) and then into five pillars. Each is named for what the visitor feels, not what the museum does, because the framework has to be judged from the other side of the velvet rope.
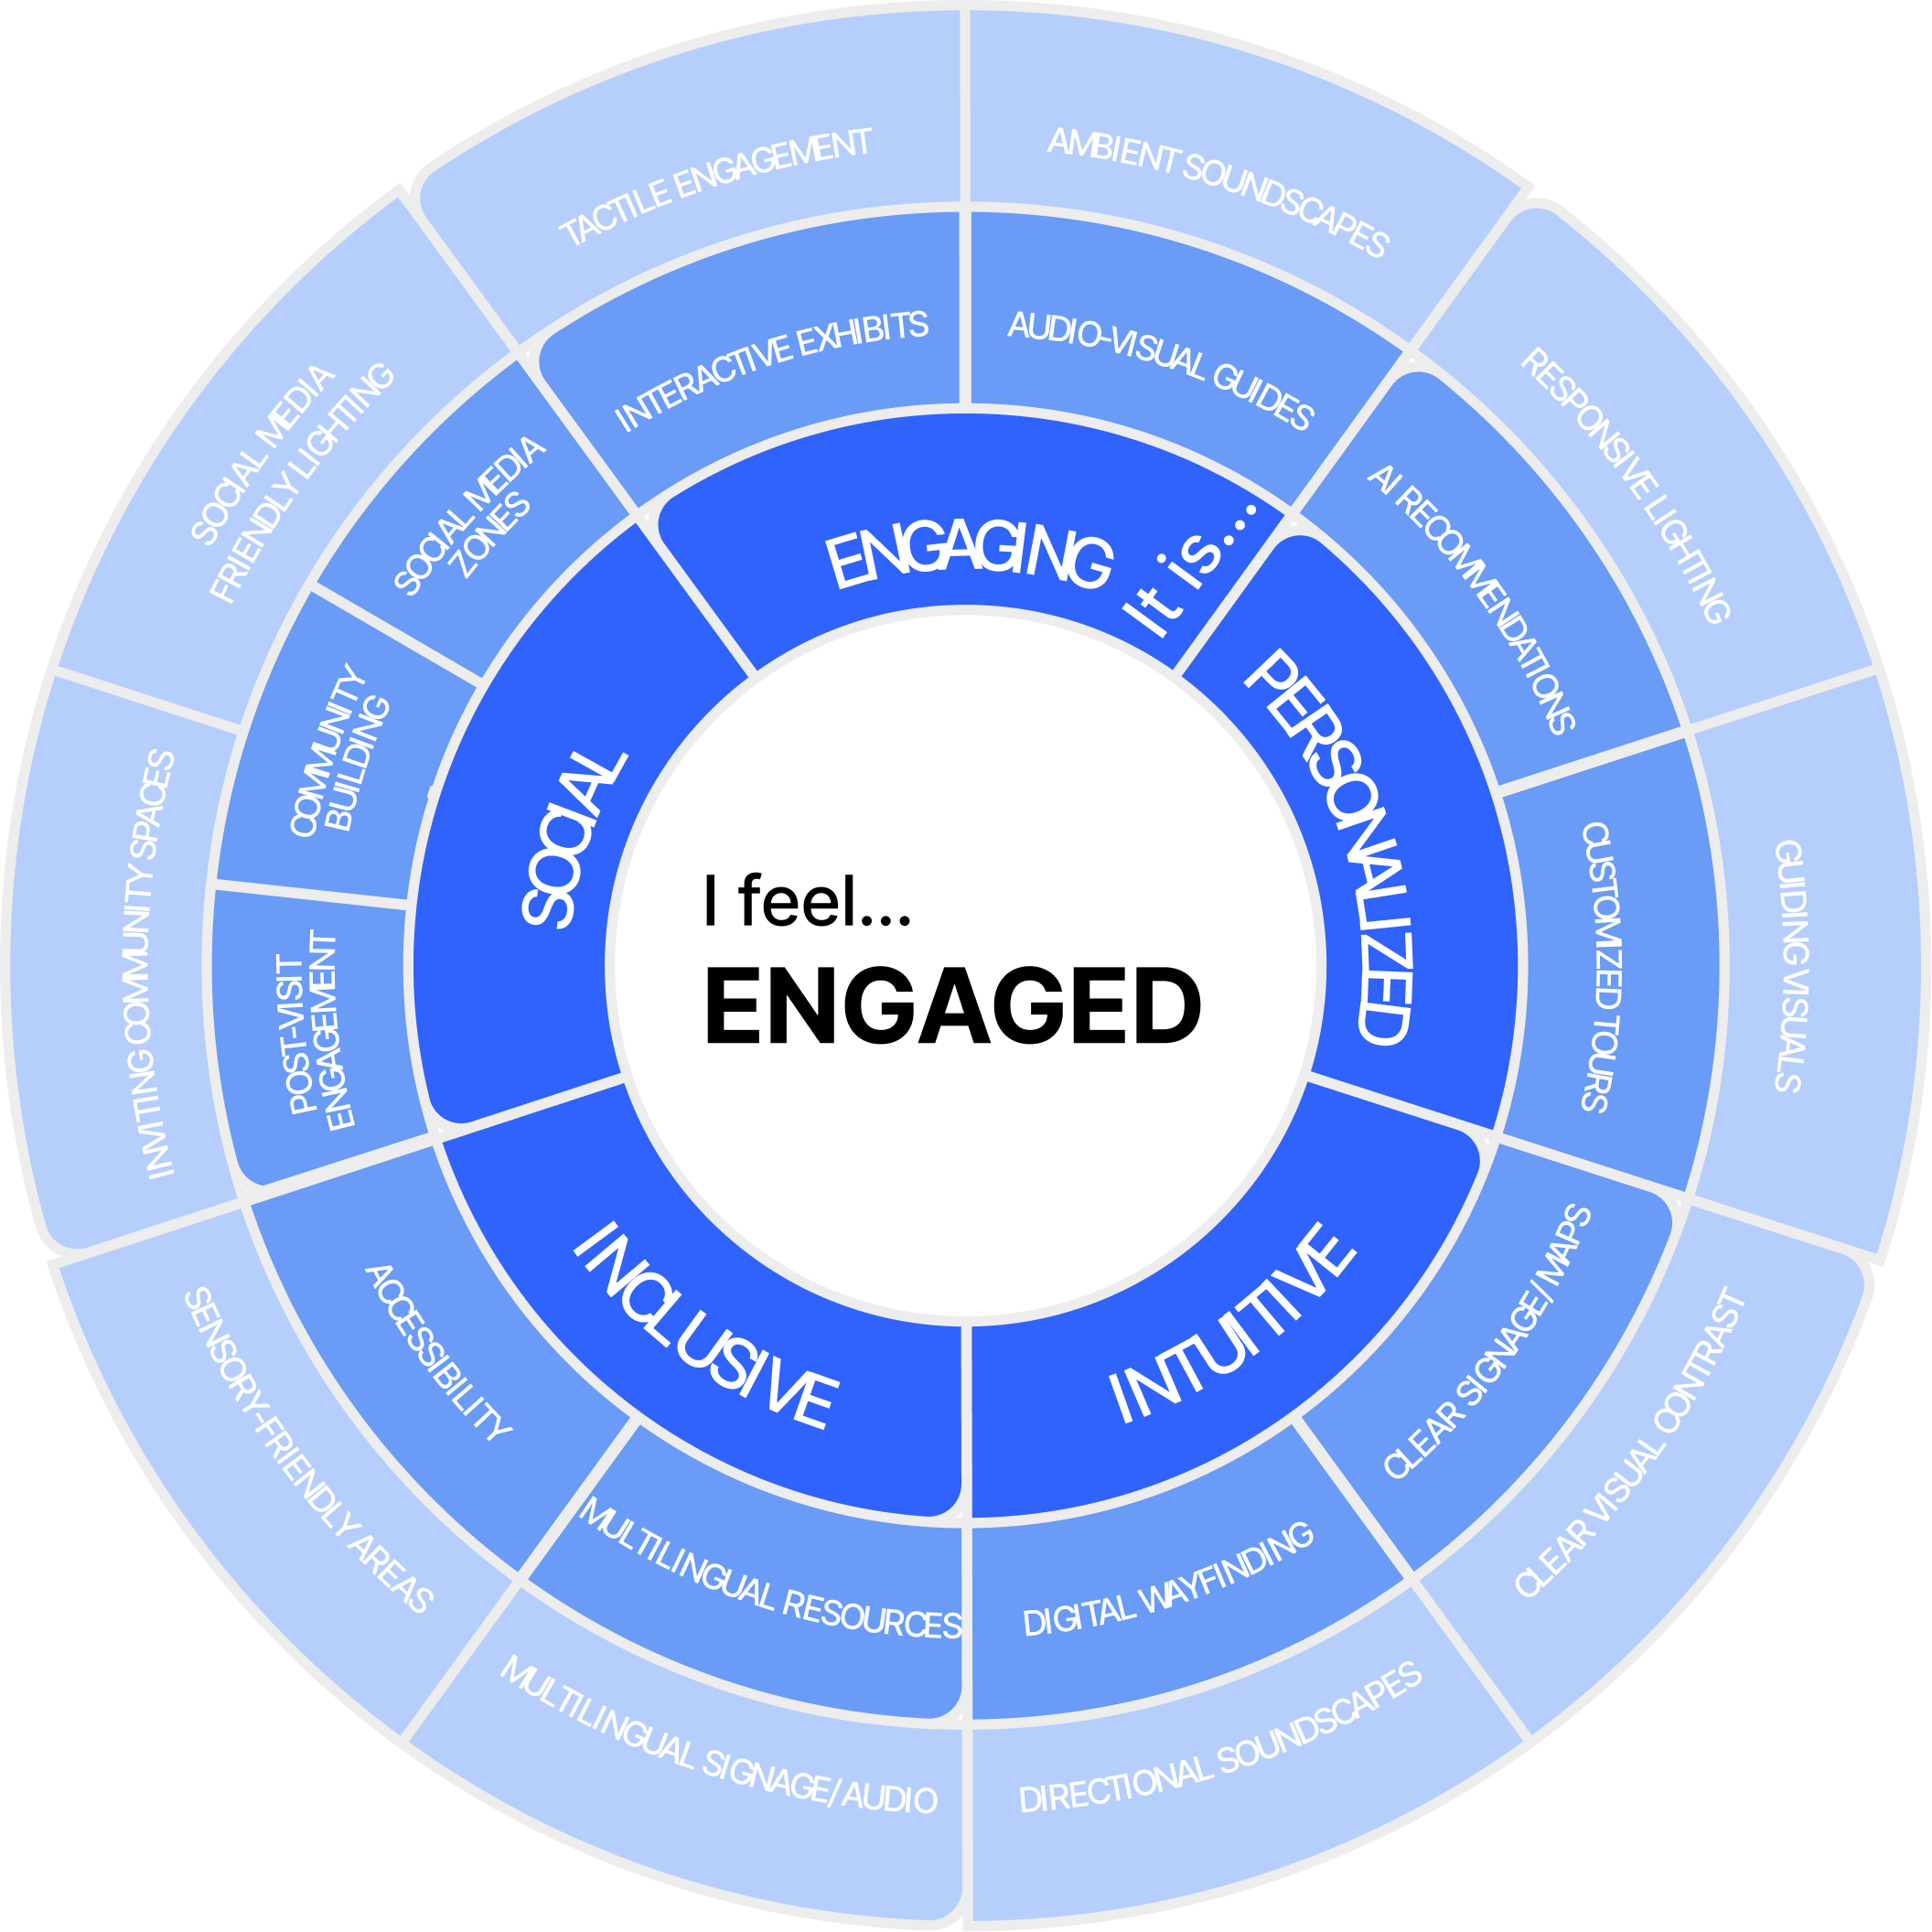
From pillars to modules
Each pillar became a module: a category of intervention that a museum could actually fund and staff. Visitor Engagement, Intuitive Navigation, Sensory Experience, Inclusive Design, and Community Building. The deck lays out each with example interventions; the body of the process book documents the research trail behind every one.
"I loved the exhibit once I found it. The problem was the forty minutes before that."
Interview participant · recent visitor
What this research was really about
The framework is one deliverable. The larger result is a shared language for talking about museum experience that isn’t the word engagement used twelve different ways. When a curator says a show should be more engaging, our framework asks which pillar: engaging in the participatory sense, personalized, intuitive, inclusive, social? The answer changes the design. Most of the time, it’s more than one.
我们反复听到的那个缺口
美术馆在流失观众,不是因为人们不再在乎艺术了。我们的问卷验证了相反的方向:86.8% 的人为艺术和文化而来,77.4% 是来学点新东西的,69.8% 会在离馆之后把这次参观发上社交媒体。动机是完整的。
断掉的是中间那段:参观本身。大家描述的是,进门时兴奋,离开时耗尽。名作前挤成一团,冷门作品前什么都没发生。墙签既不解释作品,也不解释整个房间。地图能帮上忙的前提,是你已经知道自己在找什么。
问题不是「怎么把人吸引到美术馆」,而是「来的这些人,为什么走的时候宁愿没来」。
Sarah,在一个周二
Sarah 不是美术馆从业者,也不是带着打卡清单的游客。她有足够的背景想要深度,独立到会拒绝团体导览,同时社交性强到这趟参观得告诉至少一个人才算完。
观众旅程,以及它在哪里断掉
核心失败模式:高期待 → 找路差、人挤、展陈不吸引人 → 观众失望离场。后面每一项研究动作都对准这中间三个环节里的一个。
问卷说了什么
撑起整项研究的四个数据点
n = 53。观众带着学习的动机走进来,也准备好把看到的分享出去,甚至早就在期待美术馆主动走到他一半路上。真正的设计问题,就发生在进门到出门之间。
「86.8% 为艺术与文化而来。77.4% 来学东西。」
读法:观众到场时是想要深度的。默认奔着「视觉奇观」做设计,会把这份意图白白浪费掉。
「69.8% 会把这次参观发上社交媒体。」
读法:参观并不在门口结束。观众带走的「证物」是一张照片加一条文案,而美术馆其实可以塑造它长什么样。
「43.4% 期待某种个性化。」
读法:将近一半观众已经默认美术馆会走到他们那一侧。通用导览器过不了这条线。
「60.4% 在 18–30 岁。50.9% 有硕士学历。69.8% 为女性。」
读法:样本偏年轻、偏高学历、偏女性。框架得先把他们服务好,然后「包容」这一根支柱,把他们没代表到的人接住。
墙上那十二类
访谈加上问卷里的开放回答,堆出了上百条原始观察。两周的亲和图归纳下来,我们把它们收成十二类,这是观众真正在聊美术馆时用的那套语法。
I feel ENGAGED
十二类归成三个功能族(Engaged、Informed、Connected),再往上收成五根支柱。每根的命名都是从观众感受那一侧写的,不是美术馆做了什么那一侧。因为整个框架最终得从天鹅绒围栏的另一边被评判。
从支柱到模块
每根支柱变成一个模块,一类美术馆真的能立项、能排人的介入。观众参与、直觉导航、感官体验、包容设计、社区构建。研究稿里每一个模块都带示例介入;过程册里记录了每一个的研究来路。
「那场展我找到之后是真的喜欢。问题是那之前的四十分钟。」
访谈参与者 · 近期观众
这项研究真正在做的是什么
框架是交付物之一。更大的产出,是给「美术馆体验」这件事留下一套共同语言,而不是把「engagement(参与)」这个词换十二种方式用。当策展人说一场展应该更 engaging 时,这套框架会追问:是哪一根支柱?参与感那种?还是个性化、直觉、包容,还是社交?答案不同,设计就不同。多数时候,不止一根。